Summary
- Strategic plan remains on track. The liability-led strategy, supplemented by an acceleration of asset mix shift, has reduced cost of deposits and increased lending yield.
- Remain focused on executing the plan and returning to profitable growth, meeting the bank’s strategic objectives and supporting our colleagues, customers and communities.
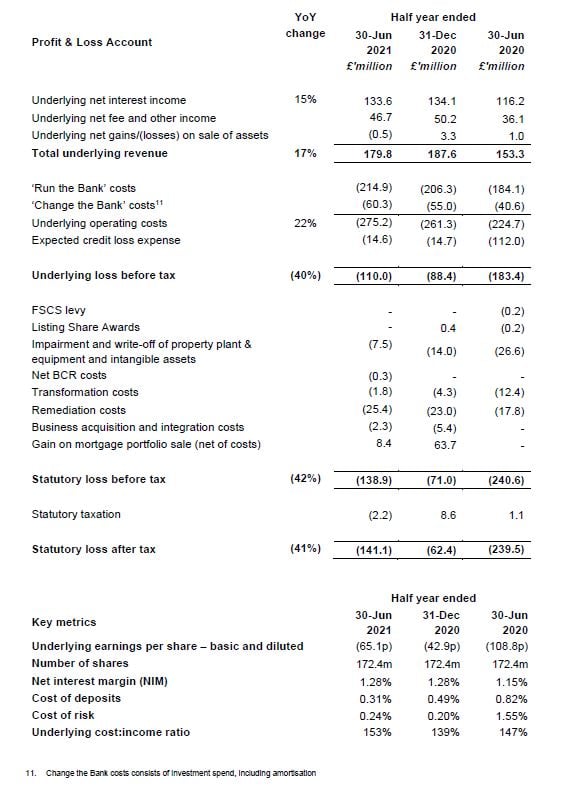
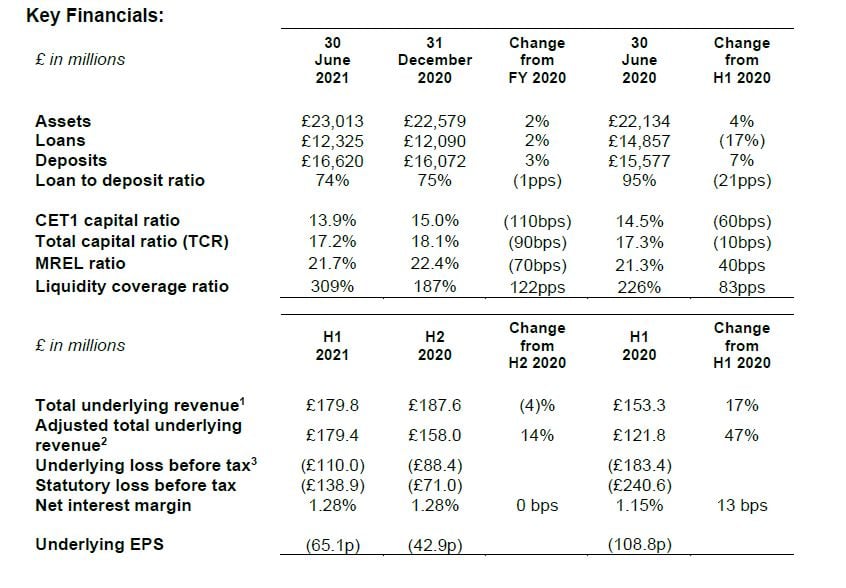
- Total underlying revenue at £179.8 million (H1 2020: £153.3 million) demonstrates the recovery of a significant portion of the income foregone from the mortgage disposal in December 2020. Adjusting for the disposal, revenue improved 47% YoY and 14% HoH.
- Cost of Deposits at 0.31% in H1 2021 (H1 2020: 0.82%) reflects continuing mix improvement, pricing action taken as well as the Base rate decrease in March 2020.
- Underlying loss before tax of £110.0 million (H1 2020: loss of £183.4 million) largely reflects a reduction in ECL expense YoY. Adjusting for the disposal, underlying loss improved 49% YoY and 6% HoH.
- Statutory loss before tax of £138.9 million (H1 2020: loss of £240.6 million) includes one-off items such as intangible impairment and remediation costs. Adjusting for the disposal, statutory loss before tax improved 46% YoY and 10% HoH.
1. Underlying revenue excludes grant income recognised relating to the Capability & Innovation fund and the gain on the mortgage portfolio sale
2. Adjusted total underlying revenue and loss before tax adjusts underlying numbers on a like for like basis by excluding loan income from the mortgage portfolio disposal announced December 2020
3. Underlying loss before tax excludes the FSCS levy (for half year figures only), Listing Share Awards, impairment and write-off of property, plant & equipment (PPE) and intangible assets, net BCR costs, transformation costs, remediation costs, business acquisition and integration costs and mortgage portfolio sale. Statutory loss after tax is included in the Profit and Loss Account.
Daniel Frumkin, Chief Executive Officer at Metro Bank, said:
“In a challenging environment, Metro Bank has continued to deliver on its strategic priorities. As a community bank our colleagues have gone above and beyond for our customers and we’ve enhanced product offerings to meet more of our customers’ needs. Financial performance reflects where we are in our turnaround plan, as well as the impact of national lockdowns. We are encouraged by the momentum we have achieved, including delivering on higher yielding mortgage products, lower cost of deposits and meaningful entry into the personal lending market. Looking ahead, we remain focused on executing the plan and returning to profitable growth, meeting the bank’s strategic objectives and supporting our colleagues, customers and communities.”
A presentation for investors and analysts will be held at 8.30AM (UK time) on 28 July 2021.
The presentation will be webcast on:
https://onlinexperiences.com/Launch/QReg/ShowUUID=D164D86C-B29F-4220-B6F2-A6F1472D95F5
For those wishing to dial-in:
From the UK dial: 0800 358 9473
From the US dial: +1 855 85 70686
Participant Pin: 87111112#
URL for other international dial in numbers:
https://events-ftp.arkadin.com/ev/docs/NE_W2_TF_Events_International_Access_List.pdf
Progress on strategic plan
Metro Bank continues to successfully deliver transformational change against all five pillars of the strategic plan set out in February 2020, despite significant headwinds presented by the pandemic.
- Balance sheet optimisation: Decisive action taken in response to the changing environment. The mortgage disposal and RateSetter back book acquisition accelerated the shift to higher yielding assets along with enhancements to existing mortgage products. Repositioning commercial lending towards full relationship trading businesses and exiting transactional real estate lending is ongoing.
- Revenue: More products launched in store including RateSetter loans and insurance offerings. Government backed lending through the Bounce Back Loan Scheme (BBLS) top-up and the Recovery Loan Scheme (RLS) to support communities. Investment in digital capability improves the multi-channel presence, launching online products such as MFLOW to support SME customers.
- Cost: Investment in automation, IT platforms and the customer service proposition provides greater efficiency and scalability. Agreed the acquisition of three further store freeholds at attractive yields, reducing costs and providing greater flexibility, expected to complete in H2. Successfully disposed of some of our central London office property (already exited, as previously announced).
- Infrastructure: The enhancements to IT, regulatory reporting and financial crime all improve the resilience of the bank. The investment in digital channels improves the customer journey and enables more FANs to take advantage of the enhanced customer proposition. Delivery of the change agenda is exceeding plan.
- Internal and external communications: Continue support for customers, colleagues and communities through the pandemic with a range of bank wide and local initiatives, as well as launching an SME marketing campaign showcasing our FANs.
4. Comprised of personal/business: June 2021 82%/18%; December 2020 85%/15%; and June 2020 86%/14%
5. SME defined as enterprises which employ fewer than 250 persons and which have an annual turnover not exceeding €50 million, and/or an annual balance sheet total not exceeding €43 million, and have aggregate deposits less than €1 million.
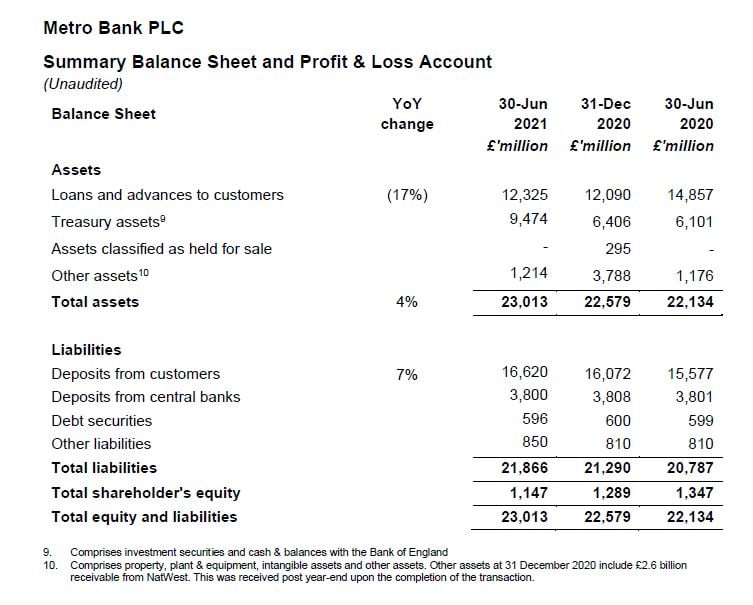
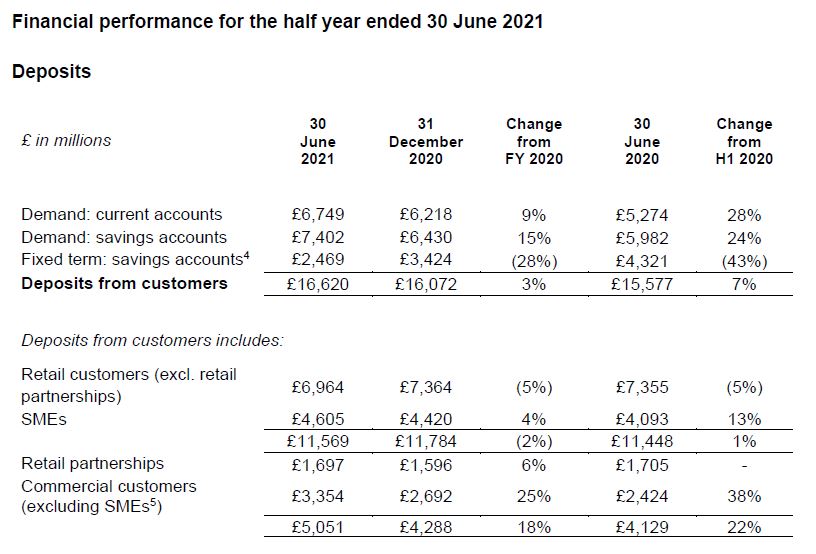
- Total deposits grew by over £0.5 billion in the first six months to £16,620 million as at 30 June 2021 (31 December 2020: £16,072 million), despite fixed term deposit (FTD) accounts falling by £1.0 billion following continued action to reduce prices. Growth largely resulted from an increase in commercial deposits, reflecting customers’ preference for increased liquidity as well as higher balances held by Conveyancing/Legal firms following elevated completion volumes towards the end of June.
Following higher than anticipated growth in the first half and transitory nature of some commercial and BBLS-related deposits, outturn in the second half will be somewhat dependent on customer behaviour. Focus will remain on maintaining a high-quality mix of relationship-driven customer deposits.
- Cost of deposits was 31bps in the first half, a decrease of 18bps compared to 49bps in 2H20, reflecting the managed roll-off of higher cost FTD accounts with a corresponding mix improvement in favour of non-interest-bearing current accounts and demand savings accounts. Cost of deposits improved throughout the period and the beneficial effects of repricing are expected to continue into the second half of 2021, although at a slower pace than H1.
- Customer account growth of 0.2 million (H2 2020: 0.1 million) in the last six months to 2.4 million, reflects incremental growth from the RateSetter back book acquisition, with an otherwise stable level of accounts owing to the managed reduction in fixed term deposits.
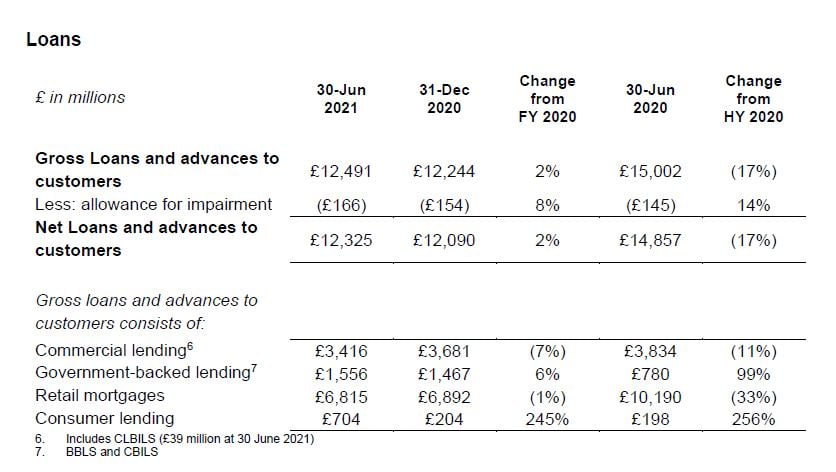
- Total net loans as at 30 June 2021 were £12,325 million, up 2% from £12,090 million at 31 December 2020 primarily reflecting the acquisition of the £337m RateSetter consumer back book in April, together with strong organic growth in consumer lending supported by the integration of the RateSetter platform, offset by the attrition of lower-yielding residential mortgages and commercial term loans. Total net loans are expected to increase in the second half of the year, with continuing mix shift towards higher yielding assets.
- Commercial loans (excluding BBLS and CBILS) decreased by 7% during H1 to £3,416 million at 30 June 2021 and are 11% below a year earlier following the attrition of lower-yielding commercial and commercial real estate term loans.
- Government backed lending increased £89 million in the first half to £1,556 million at 30 June 2021 and up £776 million from a year earlier. Growth in 1H 2021 was primarily driven by BBLS top-up applications. The bank has recently become an accredited lender for the RLS.
- Retail mortgages remained the largest component of the lending book at 55%, with mortgage applicants benefitting from enhancements to the existing mortgage offering and the launch of further specialist mortgage products during the first half of the year.
- Consumer lending increased to 6% of the of the loan book from 2% at 31 December 2020, resulting from the strong increase in organic lending as the RateSetter platform was rolled-out across all of Metro Bank’s channels and the completion of the RateSetter back book acquisition. Consumer originations averaged more than £50 million per month during 1H 2021 compared to less than £2 million per month a year earlier.
- Loan to deposit ratio was marginally lower at 74% (31 December 2020: 75%) reflecting the impact of the mortgage portfolio disposal in December and deposit inflows in the period.
- Annualised cost of risk at 0.24% (2H 2020: 0.20%) included recognition of ECL expense associated with organic and inorganic growth in consumer lending. Non-performing loans increased marginally to 2.52% (31 December 2020: 2.10%) reflecting a limited number of single name commercial exposures. The loan portfolio remains highly collateralised with average debt to value (DTV) of the residential mortgage book at 56% (31 December 2020: 56%), while DTV in the commercial book was 59% (31 December 2020: 56%).
Profit and Loss Account
- Net interest margin (NIM) at 1.28% was in line with the preceding six month period, with lower cost of deposits, improved lending mix and higher lending yield, offset by the impact of the mortgage portfolio disposal in December and higher than expected deposits.
- Underlying net interest income was broadly flat at £133.6 million (H2 2020: £134.1 million), despite the mortgage portfolio disposal in H2 2020. Adjusting for the sale net interest income increased 27% HoH.
- Underlying net fee and other income decreased 7% sequentially to £46.7 million (H2 2020: £50.2 million), as customer activity remained subdued because of COVID-19 lockdowns and other social restrictions. The outlook for H2 2021 will be significantly dependent on the pace of recovery as the country continues its path out of lockdown.
- Underlying cost:income ratio increased to 153% in 2020 from 139% in the prior six months, largely reflecting a combination of fee income headwinds, the non-repeat of an underlying net gain on sale in H2 2020 and operating cost dynamics outlined below.
‘Run the Bank’ (RTB) cost growth was less than 2% sequentially on a like for like basis, adjusting for the RateSetter acquisition or 4% in total. ‘Change the Bank’ (CTB) expenditure increased to £40.0 million plus £20.3 million of amortisation, compared to £37.6 million plus £17.4 million of amortisation in the preceding six months, in line with previous guidance.
Cost focus will continue, with low to mid-single digit percentage growth in RTB in H2 2021 compared to H1.
- Underlying loss before tax was £110.0 million, an increase from the £88.4 million loss in H2 2020, reflecting the mortgage book disposal, reduced fee and other income, inorganic cost expansion following the RateSetter platform acquisition and higher CTB investment. Adjusting for the disposal, underlying loss improved 49% YoY and 6% HoH.
- Statutory loss before tax of £138.9 million in H1 2021 (H2 2020: loss of £71.0 million) includes remediation costs primarily related to sanctions (£25.4 million) and the impairment of RateSetter peer-to-peer intangible assets (£7.5 million), partially offset by the residual gain on sale of the mortgage portfolio (£8.4 million). Adjusting for the mortgage disposal, statutory loss before tax improved 46% YoY and 10% HoH.
- Statutory loss after tax of £141.1 million in H1 2021 (H2 2020: loss of £62.4 million) after a £2.2 million corporation tax charge.
Capital, Funding and Liquidity
- Strong liquidity and funding position maintained, supported by the settlement of the mortgage portfolio disposal in February and continuing deposit growth. As a result, the Bank’s Liquidity Coverage Ratio (LCR) was elevated at 309% as of 30 June 2021 (30 December 2020: 187%). Whilst NIM dilutive, this excess liquidly is earnings neutral and provides flexibility and optionality at a time of macroeconomic uncertainty.
In H1 2021 a further £2.1 billion of maturing Term Funding Scheme (TFS) drawings were rolled into Term Funding Scheme with additional incentives for SMEs (TFSME). The Bank has capacity to roll all of its TFS drawings into TFSME.
- CET1 capital of £1,052 million as at 30 June 2021 (31 December 2020: £1,192) was 13.9% of RWA (31 December 2020: 15.0%) this compares to our minimum CET1 requirement of 9.3%8.
The Bank’s capital includes £86 million of relief provided through the EBA’s treatment of software assets, equivalent to 1.0% of CET1. As expected, the PRA announced in July that software will return to being fully deducted from 1 January 2022 and therefore this benefit is not considered when making capital decisions.
- Total capital as a percentage of RWA was 17.2% reflecting the statutory loss reported in the period. MREL resources were £1,643 million with an MREL ratio of 21.7% of RWA at 30 June 2021, this compares to our minimum interim requirement of 20.5%8 and current end-state requirement of 20.7%8. MREL resources may fall below the sum of the firm’s MREL requirement and buffers (the loss absorbing capacity) for a period of time.
- Total RWA as at 30 June 2021 was £7,563 million (31 December 2020: £7,957 million). The reduction in H1 reflects the settlement of the mortgage portfolio in February, partially offset by organic and inorganic growth in consumer lending. The result is a loan risk weight density of 47% as at 30 June 2021 (31 December 2020: 47%).
- Regulatory leverage ratio was 4.9%.
8. Based on current capital requirements including P2A requirement of 1.11% (of which 0.8% must be met with Tier 1), excluding any confidential PRA buffer, if applicable.